The Evolution of Mortgage Rates
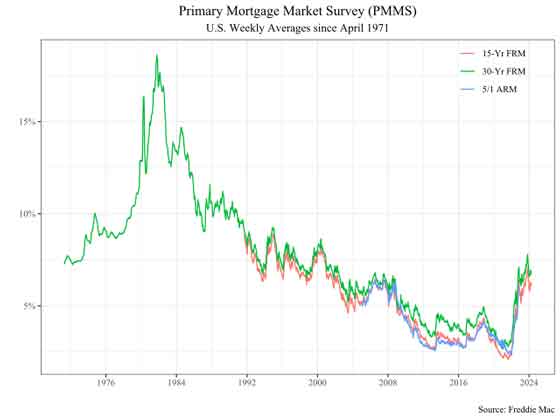
Mortgage rates have undergone significant fluctuations throughout history influenced by various economic factors, policy decisions, and market forces. Here's a detailed look at the historical trends of mortgage rates, along with the economic context for each era:
| Decade |
Average 30-Year Fixed Rate |
Key Economic Context |
| 1970s |
Started at ~7.5%, ended at 12.9% |
High inflation, oil crisis |
| 1980s |
Peaked at 18.63% (1981), ended below 10% |
Aggressive Fed actions to curb inflation |
| 1990s |
Started around 10%, dropped below 7% |
Economic stabilization |
| 2000s |
Started at 8.15%, ended at 5.14% |
Housing boom, 2008 financial crisis |
| 2010s |
Ranged from 4-5%, dropped to historic lows |
Post-recession recovery, low inflation |
| 2020s |
Hit all-time low of 2.65% (2021), rose above 6% in 2023 |
COVID-19 pandemic, economic uncertainty |
1970s: High Inflation and Oil Crisis
The 1970s saw a significant shift in mortgage rates. Starting in the mid-7% range, rates climbed steadily throughout the decade reaching 12.90% by 1979. This increase was largely due to rising inflation and economic instability. Home prices rose steadily with the median home value increasing from $24,000 in 1970 to $63,700 by 1980[2] representing a 265% increase.
Key events and developments:
- Vietnam War (ended April 30, 1975)
- 1973 Oil Crisis. Gasoline prices spiked higher 43%.
- Debut of personal computers in 1974 (mainly at workplaces)
- Culture: emergence of disco & hard rock
1980s: Volcker's Anti-Inflation Policies
The 1980s experienced even more dramatic fluctuations. Rates skyrocketed to an all-time high of 18.63% in October 1981 driven by the Federal Reserve's aggressive actions to combat runaway inflation. Yet, rates ended the decade below 10%. Unemployment reached a high of 9.7% in 1982[3]. Despite high interest rates, home prices continued to rise with the median home value reaching $123,900 by 1990 representing a 194% increase.
Notable Developments:
- – Personal computer revolution
- – Reagan-era economic policies
- – End of the Cold War with Russia (Dec. 1989)
- – Culture: debut of MTV music videos
1990s: Economic Stabilization
Mortgage rates started around 10% and dropped below 7% by decade's end. Unemployment ranged from 5.6% to 7.5%[3]. Home prices grew more moderately with the median value increasing to $172,900 by 2000 and a 51% increase decade to decade. Homes were still very affordable.
Significant Changes:
- – Widespread adoption of the internet in 1991 with email, website design, and forum message boards
- – Cell phone technology became more widespread
- – Persian Gulf War (1990-1991)
- – Mandela Elected South Africa President
- – Culture: Grunge and Gangster Rap music gain popularity
2000s: Housing Boom and Financial Crisis
Mortgage rates started at 8.15% and ended at 5.14%. Unemployment was relatively low until the 2008 crisis, peaking at 9.3% in 2009[3]. Home prices surged during the housing bubble with the median value reaching $257,100 in 2007 before declining to $219,000[3] in the first quarter of 2010.
Major Events:
- – 9/11 terrorist attacks in NYC
- – U.S. Invades Iraq & Afghanistan (2003-2011)
- – 2008 Financial Crisis (Great Recession due to bad lending practices)
- – Smartphone revolution in 2007
- – Hybrid remote work from home in 2005
- Culture: Beyonce, Rihanna, CSI & Law & Order TV show spinoffs become huge hits
2010s: Post-Recession Recovery
Mortgage rates reached historic lows, dropping below 4% at times. Unemployment gradually decreased from 9.6% in 2010 to 3.7% by 2019[3]. Home prices recovered and surpassed pre-crisis levels in many areas with the median home value reaching $327,100 by the start of 2020[2] appreciating by 49%.
Technological Advances:
- – Social media proliferation
- – Cloud computing
- – Artificial intelligence and machine learning
- – Electronic vehicles gain popularity
- Culture: not applicable
2020s: Pandemic Era and Recovery
Mortgage rates hit an all-time low of 2.65% in January 2021 but rose above 6% by 2023. Unemployment spiked to 14.7% in April 2020 due to the pandemic but quickly recovered reaching 3.6% by 2023[1]. Home prices surged during the pandemic with the median value exceeding $350,000 by 2023[2].
Huge Developments:
- – COVID-19 pandemic
- – Remote work revolution
- – Advancements in mRNA technology
- – High Inflation with consumer prices 100-200%
- – $1M median home prices are growing more common in some areas
- Culture: not applicable
This overview demonstrates how various economic factors, technological advancements, and major events have interacted to shape the housing market and broader economy over the past five decades.
Sources:
[1] https://www.statista.com/statistics/269959/employment-in-the-united-states/
[2] https://www.investopedia.com/historical-us-unemployment-rate-by-year-7495494
[3] https://data.bls.gov/timeseries/LNU04000000?periods=Annual+Data&periods_option=specific_periods&years_option=all_years
[4] https://www.macrotrends.net/1316/us-national-unemployment-rate
[5] https://fred.stlouisfed.org/series/UNRATE
[6] https://fred.stlouisfed.org/series/LNS14000024
[7] https://www.statista.com/statistics/193290/unemployment-rate-in-the-usa-since-1990/
[8] https://fred.stlouisfed.org/series/MSPUS